Aggregate statistics computed from every listing in the RoasterDB catalogue: 9,863 specialty coffees crawled from the storefronts of 280 artisan roasters, with tasting notes normalized to the SCA Flavor Wheel. Snapshot of 2026-09-14, refreshed monthly. Every figure is free to cite, quote and embed with a link to this page.
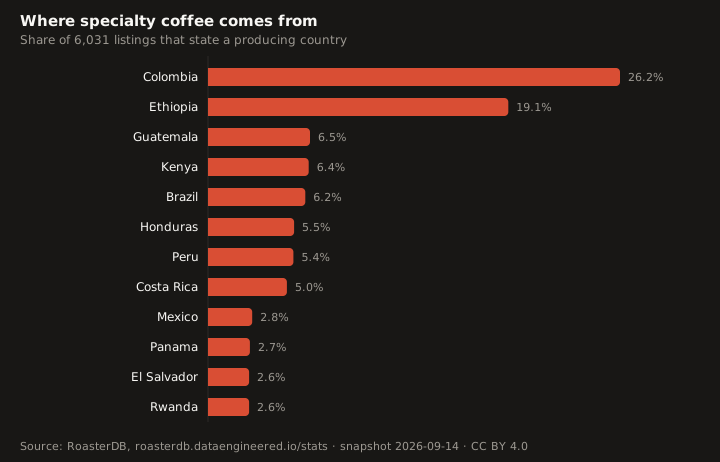
Colombia alone accounts for 26.2% of listings that name an origin, and Colombia plus Ethiopia together for 45.3%. The top five origins cover 64.4% of the catalogue; 19 producing countries appear in total.
Paste the snippet into your post. It links the chart back to this page, which is the only attribution we ask for.
<a href="https://roasterdb.dataengineered.io/stats/#origins"><img src="https://roasterdb.dataengineered.io/stats/charts/origins.svg" alt="Where specialty coffee comes from" width="720" style="max-width:100%;height:auto"></a>
<p><small>Source: <a href="https://roasterdb.dataengineered.io/stats/">RoasterDB specialty coffee statistics</a> (CC BY 4.0)</small></p>| Origin | Listings | Share |
|---|---|---|
| Colombia | 1,583 | 26.2% |
| Ethiopia | 1,154 | 19.1% |
| Guatemala | 392 | 6.5% |
| Kenya | 387 | 6.4% |
| Brazil | 374 | 6.2% |
| Honduras | 331 | 5.5% |
| Peru | 328 | 5.4% |
| Costa Rica | 303 | 5.0% |
| Mexico | 170 | 2.8% |
| Panama | 161 | 2.7% |
| El Salvador | 158 | 2.6% |
| Rwanda | 158 | 2.6% |
| Burundi | 156 | 2.6% |
| Ecuador | 132 | 2.2% |
| Bolivia | 71 | 1.2% |
| Indonesia | 70 | 1.2% |
| Uganda | 48 | 0.8% |
| Papua New Guinea | 37 | 0.6% |
| Yemen | 18 | 0.3% |
Denominator: the 6,031 of 9,863 listings whose storefront states a producing country (blends and unstated origins are excluded). When a listing names several countries, the first is counted.
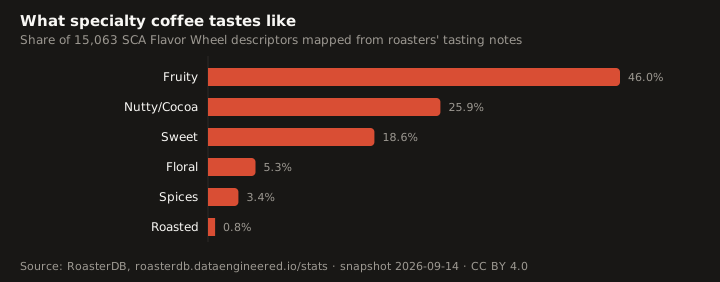
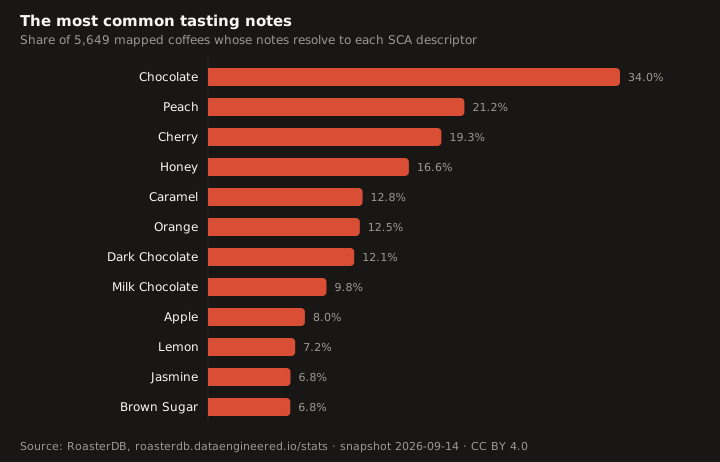
46.0% of all mapped descriptors fall in the SCA Fruity family, 25.9% in Nutty/Cocoa and 18.6% in Sweet. The single most common note is Chocolate, on 34.0% of mapped coffees, followed by Peach (21.2%) and Cherry (19.3%). A mapped coffee carries 2.67 descriptors on average.
Paste the snippet into your post. It links the chart back to this page, which is the only attribution we ask for.
<a href="https://roasterdb.dataengineered.io/stats/#flavor-families"><img src="https://roasterdb.dataengineered.io/stats/charts/flavor-families.svg" alt="What specialty coffee tastes like" width="720" style="max-width:100%;height:auto"></a>
<p><small>Source: <a href="https://roasterdb.dataengineered.io/stats/">RoasterDB specialty coffee statistics</a> (CC BY 4.0)</small></p>Paste the snippet into your post. It links the chart back to this page, which is the only attribution we ask for.
<a href="https://roasterdb.dataengineered.io/stats/#descriptors"><img src="https://roasterdb.dataengineered.io/stats/charts/descriptors.svg" alt="The most common tasting notes" width="720" style="max-width:100%;height:auto"></a>
<p><small>Source: <a href="https://roasterdb.dataengineered.io/stats/">RoasterDB specialty coffee statistics</a> (CC BY 4.0)</small></p>| Descriptor | SCA family | Subcategory | Coffees | Share of mapped coffees |
|---|---|---|---|---|
| Chocolate | Nutty/Cocoa | Cocoa | 1,922 | 34.0% |
| Peach | Fruity | Other Fruit | 1,196 | 21.2% |
| Cherry | Fruity | Other Fruit | 1,089 | 19.3% |
| Honey | Sweet | Honey | 937 | 16.6% |
| Caramel | Sweet | Brown Sugar | 721 | 12.8% |
| Orange | Fruity | Citrus Fruit | 708 | 12.5% |
| Dark Chocolate | Nutty/Cocoa | Cocoa | 682 | 12.1% |
| Milk Chocolate | Nutty/Cocoa | Cocoa | 553 | 9.8% |
| Apple | Fruity | Other Fruit | 452 | 8.0% |
| Lemon | Fruity | Citrus Fruit | 407 | 7.2% |
| Jasmine | Floral | Floral | 385 | 6.8% |
| Brown Sugar | Sweet | Brown Sugar | 384 | 6.8% |
| Strawberry | Fruity | Berry | 367 | 6.5% |
| Raspberry | Fruity | Berry | 344 | 6.1% |
| Grape | Fruity | Other Fruit | 300 | 5.3% |
Roasters' free-text tasting notes are normalized to the SCA Coffee Taster's Flavor Wheel (Category > Subcategory > Descriptor). 5,649 of 9,863 listings have at least one mapped descriptor; family shares use all 15,063 coffee-to-descriptor links, descriptor shares count coffees.
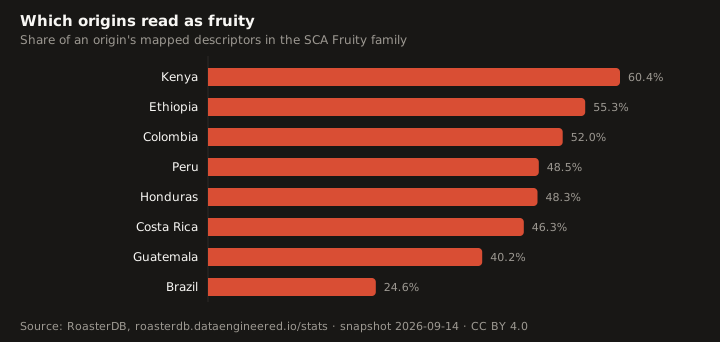
Kenya is the fruitiest origin in the catalogue: 60.4% of its mapped descriptors are Fruity, against 24.6% for Brazil. Brazil leads the Nutty/Cocoa family at 51.7%.
Paste the snippet into your post. It links the chart back to this page, which is the only attribution we ask for.
<a href="https://roasterdb.dataengineered.io/stats/#fruity-by-origin"><img src="https://roasterdb.dataengineered.io/stats/charts/fruity-by-origin.svg" alt="Which origins read as fruity" width="720" style="max-width:100%;height:auto"></a>
<p><small>Source: <a href="https://roasterdb.dataengineered.io/stats/">RoasterDB specialty coffee statistics</a> (CC BY 4.0)</small></p>| Origin | Descriptors | Fruity | Nutty/Cocoa | Sweet | Floral | Spices | Roasted |
|---|---|---|---|---|---|---|---|
| Colombia | 3,139 | 52.0% | 20.7% | 18.6% | 6.0% | 2.1% | 0.7% |
| Ethiopia | 2,400 | 55.3% | 19.0% | 12.9% | 7.9% | 4.0% | 0.9% |
| Guatemala | 860 | 40.2% | 33.5% | 19.5% | 2.8% | 2.8% | 1.2% |
| Brazil | 779 | 24.6% | 51.7% | 20.3% | 1.2% | 1.8% | 0.4% |
| Costa Rica | 663 | 46.3% | 18.6% | 28.4% | 4.1% | 2.6% | 0.2% |
| Kenya | 661 | 60.4% | 9.2% | 15.9% | 10.3% | 3.9% | 0.3% |
| Honduras | 627 | 48.3% | 23.1% | 18.8% | 5.3% | 3.5% | 1.0% |
| Peru | 608 | 48.5% | 24.3% | 18.1% | 5.4% | 3.1% | 0.5% |
Per origin, the share of its mapped descriptors in each SCA family (rows sum to 100%). Only the eight origins with the most mapped descriptors are shown.
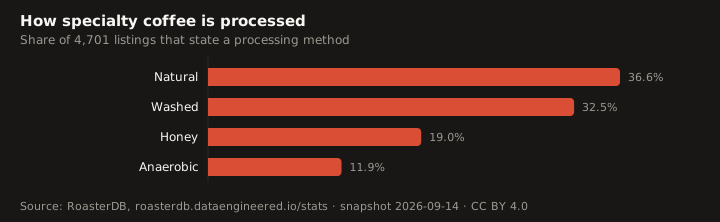
Among listings that state a method, 36.6% are Natural and 32.5% Washed. Experimental fermentation is no longer niche: Anaerobic lots are 11.9% of stated methods.
Paste the snippet into your post. It links the chart back to this page, which is the only attribution we ask for.
<a href="https://roasterdb.dataengineered.io/stats/#process"><img src="https://roasterdb.dataengineered.io/stats/charts/process.svg" alt="How specialty coffee is processed" width="720" style="max-width:100%;height:auto"></a>
<p><small>Source: <a href="https://roasterdb.dataengineered.io/stats/">RoasterDB specialty coffee statistics</a> (CC BY 4.0)</small></p>| Process | Listings | Share |
|---|---|---|
| Natural | 1,722 | 36.6% |
| Washed | 1,530 | 32.5% |
| Honey | 891 | 19.0% |
| Anaerobic | 558 | 11.9% |
Denominator: the 4,701 of 9,863 listings whose storefront states one of Washed, Natural, Honey or Anaerobic. Listings whose process is unstated or non-standard are excluded.
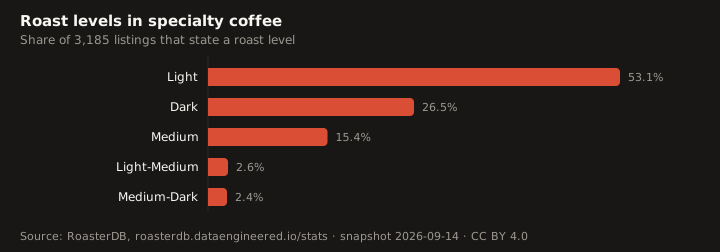
Specialty roasters roast light: 55.7% of listings with a stated roast level are Light or Light-Medium, against 28.9% Dark or Medium-Dark.
Paste the snippet into your post. It links the chart back to this page, which is the only attribution we ask for.
<a href="https://roasterdb.dataengineered.io/stats/#roast"><img src="https://roasterdb.dataengineered.io/stats/charts/roast.svg" alt="Roast levels in specialty coffee" width="720" style="max-width:100%;height:auto"></a>
<p><small>Source: <a href="https://roasterdb.dataengineered.io/stats/">RoasterDB specialty coffee statistics</a> (CC BY 4.0)</small></p>| Roast level | Listings | Share |
|---|---|---|
| Light | 1,690 | 53.1% |
| Dark | 845 | 26.5% |
| Medium | 490 | 15.4% |
| Light-Medium | 82 | 2.6% |
| Medium-Dark | 78 | 2.4% |
Denominator: the 3,185 listings that state a roast level. Most storefronts do not, so this is a sample of the catalogue, not the whole.
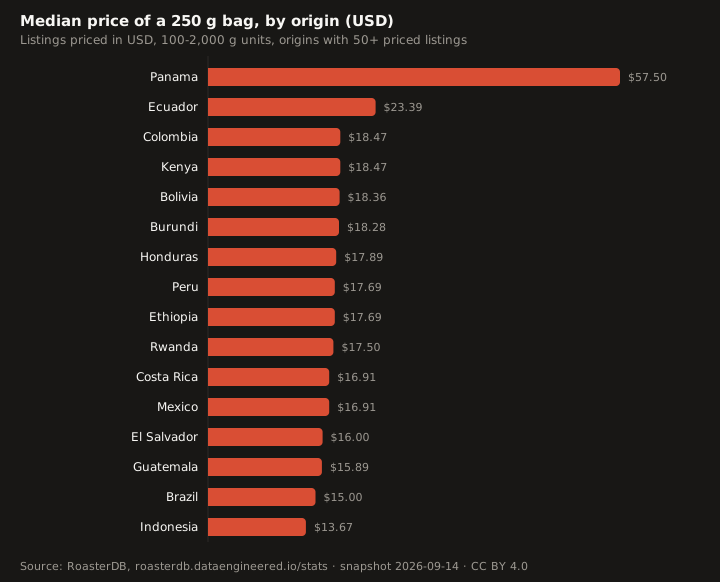
The median specialty coffee lists at $17.34 per 250 g (interquartile range $13.12 to $22.00). Panama is the most expensive origin at a median $57.50, 3.3 times the catalogue median; Indonesia is the cheapest at $13.67. Lots naming the Gesha varietal carry a 1.46x premium: median $25.09 against $17.17 for other named varietals.
Paste the snippet into your post. It links the chart back to this page, which is the only attribution we ask for.
<a href="https://roasterdb.dataengineered.io/stats/#price-by-origin"><img src="https://roasterdb.dataengineered.io/stats/charts/price-by-origin.svg" alt="Median price of a 250 g bag, by origin (USD)" width="720" style="max-width:100%;height:auto"></a>
<p><small>Source: <a href="https://roasterdb.dataengineered.io/stats/">RoasterDB specialty coffee statistics</a> (CC BY 4.0)</small></p>| Origin | Priced listings | Median USD per 250 g |
|---|---|---|
| Panama | 129 | $57.50 |
| Ecuador | 123 | $23.39 |
| Colombia | 1,448 | $18.47 |
| Kenya | 346 | $18.47 |
| Bolivia | 65 | $18.36 |
| Burundi | 146 | $18.28 |
| Honduras | 316 | $17.89 |
| Peru | 307 | $17.69 |
| Ethiopia | 1,041 | $17.69 |
| Rwanda | 147 | $17.50 |
| Costa Rica | 286 | $16.91 |
| Mexico | 165 | $16.91 |
| El Salvador | 140 | $16.00 |
| Guatemala | 366 | $15.89 |
| Brazil | 324 | $15.00 |
| Indonesia | 60 | $13.67 |
| Segment | Priced listings | Median USD per 250 g |
|---|---|---|
| Anaerobic | 505 | $18.52 |
| Honey | 826 | $18.00 |
| Washed | 1,362 | $17.65 |
| Natural | 1,524 | $16.25 |
| Light-Medium | 80 | $17.58 |
| Light | 1,408 | $16.76 |
| Dark | 748 | $15.00 |
| Medium | 422 | $14.71 |
| Medium-Dark | 73 | $14.71 |
Prices are the storefront list price at crawl time, normalized to 250 g. Filters: USD listings only; unit weight 100 to 2,000 g (excludes sample sachets and bulk units); $5 to $150 per 250 g (excludes subscriptions, gift sets and mis-parsed prices). 8,306 of 9,753 USD-priced listings pass. Medians, not means, so a few very expensive lots do not move the figures. Gesha premium: 619 lots naming Gesha or Geisha against 2,240 lots naming another varietal.
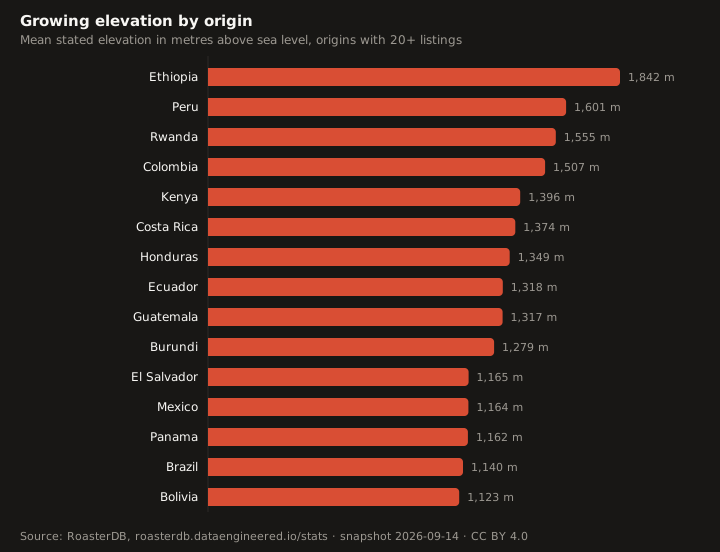
Ethiopia lots are grown highest, at a mean 1,842 m above sea level, 719 m above Bolivia (1,123 m).
Paste the snippet into your post. It links the chart back to this page, which is the only attribution we ask for.
<a href="https://roasterdb.dataengineered.io/stats/#elevation"><img src="https://roasterdb.dataengineered.io/stats/charts/elevation.svg" alt="Growing elevation by origin" width="720" style="max-width:100%;height:auto"></a>
<p><small>Source: <a href="https://roasterdb.dataengineered.io/stats/">RoasterDB specialty coffee statistics</a> (CC BY 4.0)</small></p>| Origin | Listings with elevation | Mean elevation (masl) |
|---|---|---|
| Ethiopia | 281 | 1,842 |
| Peru | 109 | 1,601 |
| Rwanda | 56 | 1,555 |
| Colombia | 463 | 1,507 |
| Kenya | 121 | 1,396 |
| Costa Rica | 110 | 1,374 |
| Honduras | 92 | 1,349 |
| Ecuador | 20 | 1,318 |
| Guatemala | 116 | 1,317 |
| Burundi | 32 | 1,279 |
| El Salvador | 56 | 1,165 |
| Mexico | 30 | 1,164 |
| Panama | 62 | 1,162 |
| Brazil | 74 | 1,140 |
| Bolivia | 36 | 1,123 |
Elevation is stated on 1,713 listings; where a range is given its midpoint is used. Origins with fewer than 20 stated elevations are omitted.
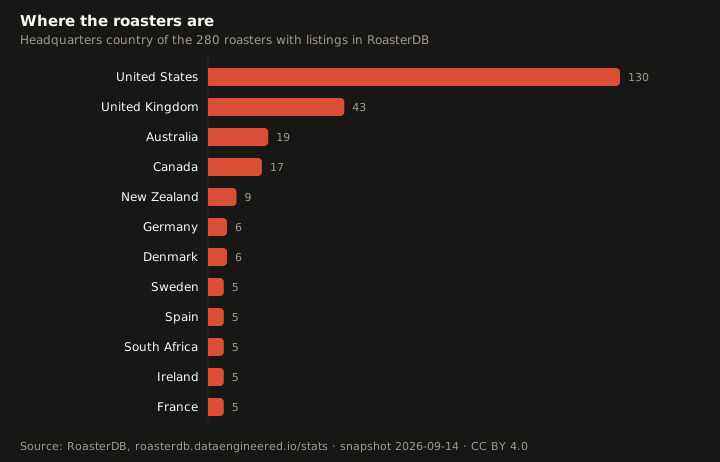
46.4% of the roasters in the catalogue are headquartered in United States, 15.4% in United Kingdom; 23 countries are represented.
Paste the snippet into your post. It links the chart back to this page, which is the only attribution we ask for.
<a href="https://roasterdb.dataengineered.io/stats/#roasters-by-country"><img src="https://roasterdb.dataengineered.io/stats/charts/roasters-by-country.svg" alt="Where the roasters are" width="720" style="max-width:100%;height:auto"></a>
<p><small>Source: <a href="https://roasterdb.dataengineered.io/stats/">RoasterDB specialty coffee statistics</a> (CC BY 4.0)</small></p>| Country | Roasters | Share |
|---|---|---|
| United States | 130 | 46.4% |
| United Kingdom | 43 | 15.4% |
| Australia | 19 | 6.8% |
| Canada | 17 | 6.1% |
| New Zealand | 9 | 3.2% |
| Germany | 6 | 2.1% |
| Denmark | 6 | 2.1% |
| Sweden | 5 | 1.8% |
| Spain | 5 | 1.8% |
| South Africa | 5 | 1.8% |
| Ireland | 5 | 1.8% |
| France | 5 | 1.8% |
| Singapore | 4 | 1.4% |
| Netherlands | 4 | 1.4% |
| Norway | 3 | 1.1% |
| Japan | 3 | 1.1% |
| United Arab Emirates | 2 | 0.7% |
| Portugal | 2 | 0.7% |
| Finland | 2 | 0.7% |
| Belgium | 2 | 0.7% |
| Philippines | 1 | 0.4% |
| Italy | 1 | 0.4% |
| Hong Kong | 1 | 0.4% |
RoasterDB is a curated crawl of artisan roasters' own storefronts, so this describes the catalogue's coverage rather than the world's roaster population.
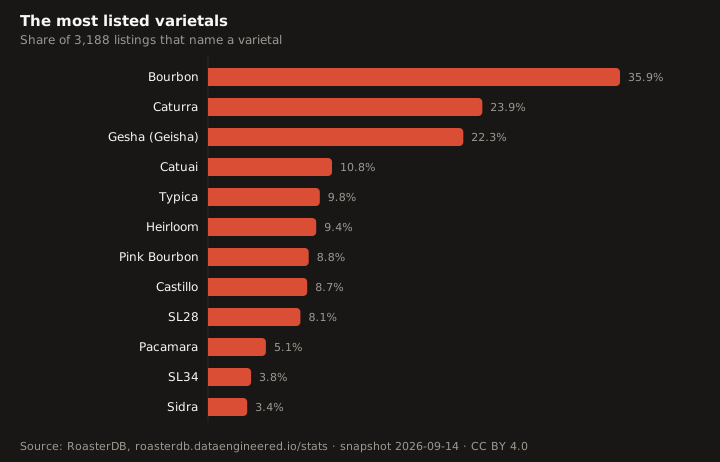
Bourbon is the most frequently named cultivar, on 35.9% of listings that state a varietal, with Caturra second at 23.9%.
Paste the snippet into your post. It links the chart back to this page, which is the only attribution we ask for.
<a href="https://roasterdb.dataengineered.io/stats/#varietals"><img src="https://roasterdb.dataengineered.io/stats/charts/varietals.svg" alt="The most listed varietals" width="720" style="max-width:100%;height:auto"></a>
<p><small>Source: <a href="https://roasterdb.dataengineered.io/stats/">RoasterDB specialty coffee statistics</a> (CC BY 4.0)</small></p>| Varietal | Listings | Share |
|---|---|---|
| Bourbon | 1,146 | 35.9% |
| Caturra | 763 | 23.9% |
| Gesha (Geisha) | 710 | 22.3% |
| Catuai | 345 | 10.8% |
| Typica | 311 | 9.8% |
| Heirloom | 301 | 9.4% |
| Pink Bourbon | 280 | 8.8% |
| Castillo | 276 | 8.7% |
| SL28 | 257 | 8.1% |
| Pacamara | 161 | 5.1% |
| SL34 | 120 | 3.8% |
| Sidra | 109 | 3.4% |
Denominator: the 3,188 listings that name at least one varietal. A listing naming several counts once for each. Gesha and Geisha are spellings of the same cultivar and are merged.
Every listing with its origin, process, roast, varietals, price and SCA flavor nodes, as SQLite, CSV and JSON.
Get the full dataset ($49) →